
What a sap test shows
A soil test estimates what’s in the soil: what’s in the pantry. A leaf test tells you the total the leaf is holding, built in and loose together. A sap test reads the juice pressed from fresh leaves: what they’re holding loose on the day, not yet built in. That’s why a sap test moves sooner, and can warn you before the leaves show a thing.
Minerals, any kind. The juice in the cells: the sap.
-
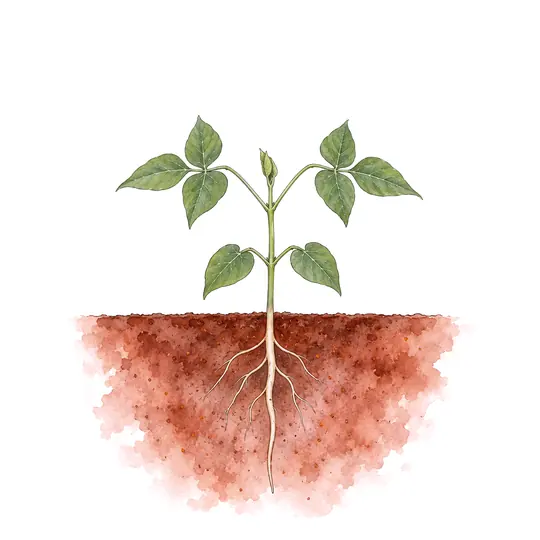
Soil test
a young bean in its soil
what’s in the soil: the pantry
-
Leaf test
one leaf, its cells magnified
the total the leaf holds, built in and loose together
-
Sap test
the same leaf’s cells, magnified
what the leaves hold loose on the day, so it shows a change first

How is it shifting?
Plenty of growers already sap test. “Oh yeah, we do saps,” they tell Steve. They get a number back, and that’s where it stops. But a single number, as he says, is “just telling you what’s in the healthy part of the plant.” The question Steve asks is: how is it shifting? That’s when, he says, you start to understand which minerals are mobile and which aren’t.
A run of tests across the season shows which way the plant is heading, often early enough to act on it this season.
-
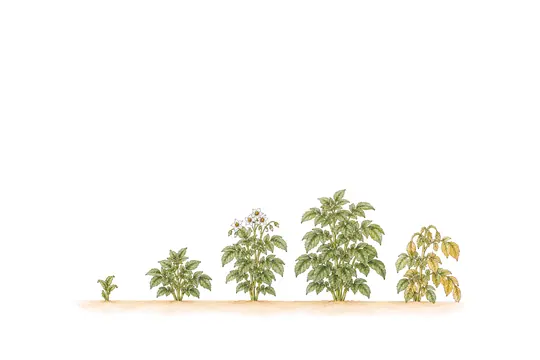
How is it shifting?
a sap test every few weeks
one test is a snapshot; a season of them shows which way the plant is heading

Anyone can graph the numbers. What Steve gives growers is the trend interpretation: what’s holding steady, what’s falling, why, and what to do about it.
“Here’s the trend analysis, but what I give them is the trend interpretation.”
Old leaves and new
Test the older leaves and the new growth side by side, and the gap between them tells you something. Nitrogen, phosphorus and potassium usually run higher in the new growth, so some gap is normal. A gap that is wide, or that widens from one test to the next, shows the plant robbing the old leaves to keep up: the supply is falling behind. When the new growth is low for the crop in a mineral that stays put, the plant can’t borrow it from anywhere, so the supply isn’t keeping up with the new growth. The Mobile and immobile minerals page has the list.
Potassium, in the sap. Potassium gone from a leaf. A sap test of the leaves, old and new.
-
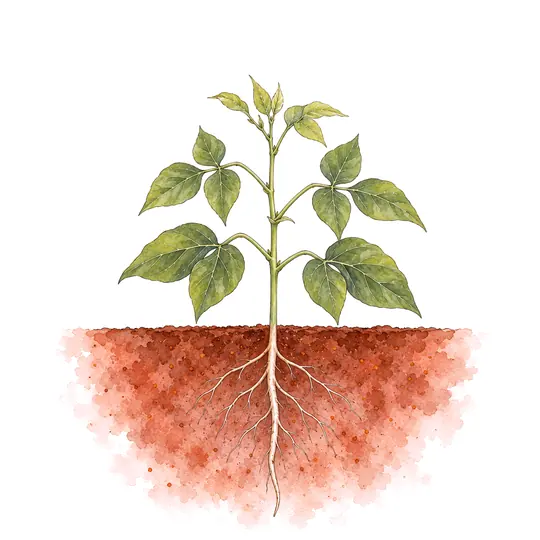
A normal gap
a bean, its old leaves and new growth tested
potassium a little higher in the new growth: some gap is normal
-
A widening gap
the same bean, two weeks on
the supply’s falling behind, so the plant robs its old leaves for the new growth, before any leaf shows it

Tests you can compare
A trend only means something if the tests are taken the same way every time:
- The same leaves: the same spot on the plant, old leaves and new.
- The same time of day. Morning, before the heat, is usual.
- Clean leaves, picked away from dusty edges and roads, rather than dirty ones washed. Dust on a leaf can read as iron and aluminium in it. If you must clean one, wipe it or rinse it quickly and pat it dry: soaking washes minerals out of the leaf.
- The same lab and the same handling: kept cool but not frozen, and there as fast as you can, ideally within a day.
- Timed to the stages: just ahead of each critical stage, so there’s time to act before it, not after.
- Written up beside what you applied and what the weather did.
A sap test.
-
The same way every time
the same leaves, the same time of day, the same lab
the dots make a line you can read: which way the crop is heading
-
Any old way
any leaf, any time of day, any lab
the dots jump about, and the line means nothing
How Steve writes one up
Steve’s write-up of a sap report runs in this order. What the numbers mean for the crop comes first, and the numbers themselves near the end:
- The crop, the date and its stage, and how the sample was taken. The stage is what gives a number its meaning: his bean report opens on the crop moving from cell expansion into sizing.
- Why it matters for yield. That’s what growers focus on, so it comes in early.
- Where the crop is heading, and the mechanism behind it.
- An honest prediction. For the beans: they’ll size up fast, on the water and the potassium, but their structure and their resistance to disease will be fragile.
- The risk, and what the crop needs.
- The key insights: the big wins, the bottlenecks, and anything wrong with the structure, starting from the foundation.
- The data, and the trend across the season as graphs.
- Recommendations that teach, with the practical reasons behind them.
Each of the findings his reports cover has its own page here:
- Nitrogen, and how well the plant is turning it into protein. As Steve says, all nitrogen is not equal. The Nitrogen page explains.
- Structure and mobility: the foundation, and which minerals are moving. The Calcium and Mobile and immobile minerals pages have it.
- Energy: how well the leaves are working. The Photosynthetic efficiency page has it.
- Stress, with salt and chloride among it. The Stress and salt page has it.
How Steve uses them
Steve builds sap tests into the flight plan, his plan for the season, stage by stage. For a poppy crop, that meant tests at the rosette, at stem elongation, while the capsule was sizing, and at maturity. In a bean crop, the tests showed calcium dropping hard right through cell division, so next season’s program puts a calcium foliar spray in at that stage. The Cell division windows page has more.
“How is it shifting?”